India’s GDP is projected to grow by 6.7% during Q3’FY24 as per RBI’s state of the economy report published yesterday. However, its projection may be conservative as it had projected GDP growth of 6.6% for Q2’24 in Sept’23 whereas actual growth turned out to be 7.6%. Here is a look at the performance of some of the key high-frequency indicators.
The projection is based on an economic activity index (EAI) model. EAI is constructed based on the performance of high-frequency indicator for which data is available for the month of Oct and Nov’23. With the actual data being released two months after the end of the quarter (data for Dec’23 quarter would be released by 28th Feb’24), the model helps get an idea of the underlying momentum of the economy.
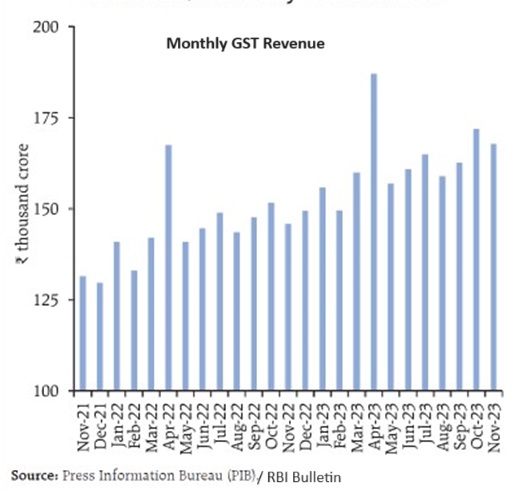
Taxes, E-way bills –
The most definitive sign of economic activity is the growth in indirect tax collection. During Oct-Nov’23, GST collection has grown by over 14% against growth of 11% in Q2. For Nov’23, growth is 15%, the highest in last 11 months and possibly indicates increasing momentum. Economic activity is also captured through e-way bills, which reflects movement of goods for sale. Generation of e-way bills recorded growth of almost 20% in Oct-Nov’23, higher than 15% in Q2. However, growth in intra-state bills has risen from 19% to 26% whereas inter-state movement has come down slightly from 10% to 8%. This could signify higher movement from production to distribution centre in Q2 but higher movement from distribution to consumption centre in Oct-Nov. Another high-frequency indicator, toll collection through NETC (National Electronic Toll Collection) has recorded growth of 20% in Oct-Nov’23. While this is nearly same as Q2, growth rate is quite robust and may not have much scope beyond this. Toll collection reflects both freight and passenger movement.
Manufacturing Sub-sectors –
An important indicator of economic activity and sentiments is PMI (Purchasing Managers’ Index), derived from monthly surveys of private sector companies. As per the RBI bulletin, PMI for both manufacturing and services are lower than Q2. For manufacturing, PMI is 55.8 in Oct-Nov, down from about 58 in Q2. A figure above 50 indicates expectation of higher activity. Services PMI has also declined, from average 61.1 during Q2 to 57.7 in Oct-Nov.
Steel and Cement consumption growth, considered a proxy for the performance of construction sector is mixed. Construction is among the largest employer of blue collared workers and an important indicator of overall industrial activity. Cement has picked up from average 10% in Q2 to 17% in Oct. (Nov data is not available). However, steel consumption growth has come down to 14% during Oct-Nov from 7% in Q2.
The other sector for which data is available is automobile where three of four sub-segments have performed better than Q2. For passenger vehicles, growth rate has improved from 6% to 11%, for 2-wheelers, from -2% to sharp 26% and for tractors, from -2.5% to 1.1%. While 3-wheelers growth rate is down from 65% to 36%, it is primarily due to low base effect as sales were lower by 34% and 19% in the same period of previous year. Three wheelers had seen sales shrink by as much as 50% until June’22 quarter.
A sector for which information has been added recently is hotel industry. The occupancy rate, which averaged 68% in 2019 and had fallen to 10% in April’20 stands at 62.5% in Oct, higher than 61% in Q2. Increase in average room rates are about the same level as in the previous quarter.
Freight & Fuel –
Among the other lead indicators of industrial activity is freight traffic movement by Railways. As per the RBI report, railway freight traffic grew by 8.5% during Oct-Nov’23 against 5% in Q2. Port traffic, mode of transport indicating global trade, stands at 15% in Oct-Nov, against only 3% in Q2 which implies significant pickup in trade. However, if this has been more due to imports than exports, that would mean imports are eating into domestic producers share. In case of aviation, the worst affected across the transport sector, one of the segment is still lower than pre Covid value. Domestic and international passenger traffic have grown by 10% and 19% in Oct-Nov, lower than 22% in Q2. While growth rate is lower than Q2 for both, it is again due to lower base effect. Domestic and international cargo traffic have performed better; growing by 6% and 10%, against less than 4% in Q2.
Another indicator of industrial activity is consumption of electricity as over 40% of power is consumed by industries. Index of industrial production (IIP) for electricity rose sharply, by 20% in Oct against growth of 10% in Q2. A related sector is petroleum & petroleum products, which indirectly reflects movement of goods and passenger. Consumption of petroleum products increased by 6% in Oct-Nov against less than 2% in Q2.