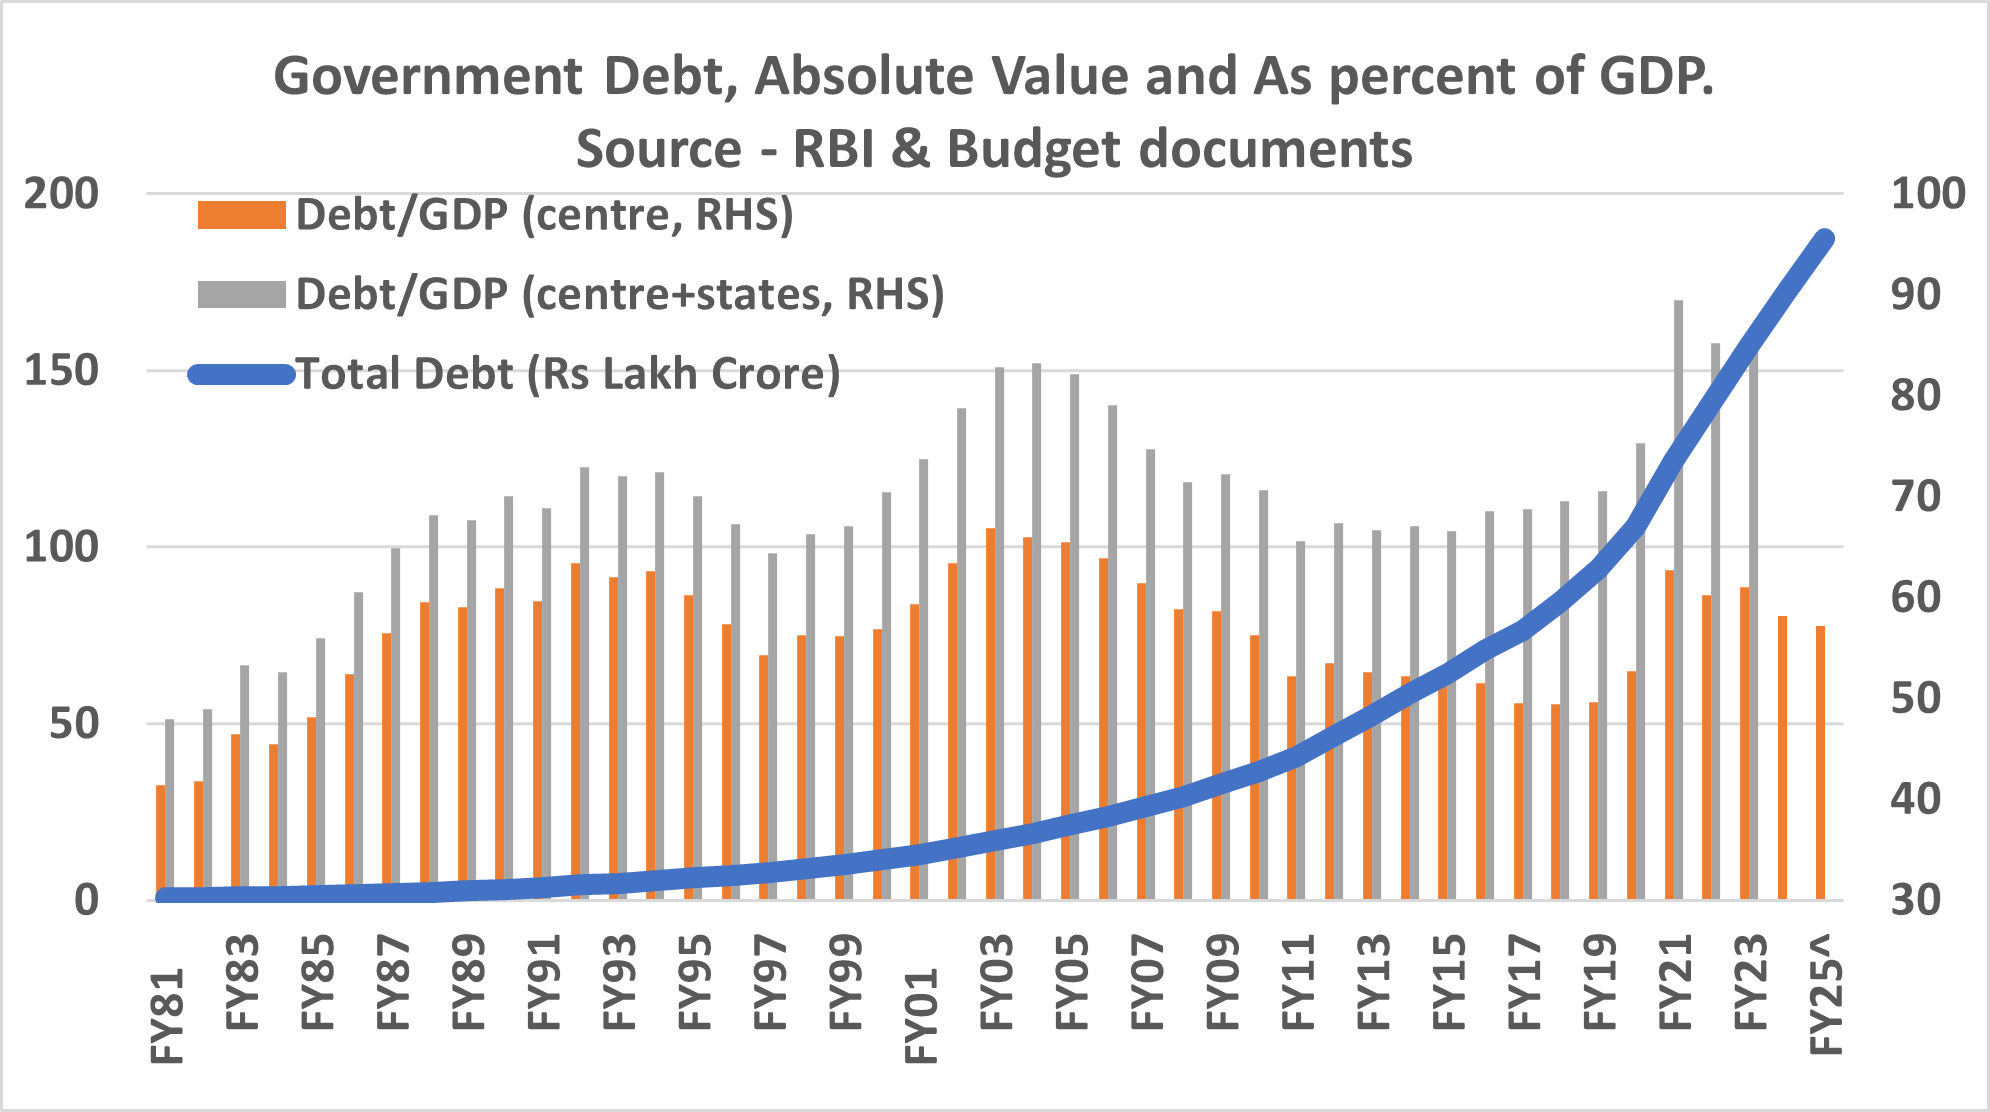
Central government’s total debt is projected to increase to Rs 187 lakh crore by the end of FY25, as per the budget projections. This corresponds to an increase of 8.7% over FY24, the lowest since FY17. The debt had increased by a sharp 18% in FY21. As a percent of GDP, a critical parameter to gauge the capability of a nation to manage its debt, debt would come down from 62.8% in FY21 to 57.2% in FY25. Here is a look at the status of government’s borrowings and related issues.
As per the budget documents, central government would run a fiscal deficit, excess of expenditure over revenue, of Rs 16.8 lakh crore in FY25. The deficit is lower than FY23 and FY24 but higher than pre-covid years. While the current debt movement is unavoidable because of expenses incurred during Covid, it is a reminder of the government finances before 1990s. During 1980-90, central government’s debt rose by as much as 19.4% CAGR! This came down to 14% in FY90-2000, 12% and 11% during the next two decades. Increasing government debt affects four figures – total debt as a percent of GDP, government’s interest payments, interest payments as a percent of government’s total expenditure and cost of borrowings. (The last parameter would be affected by other factors also).
Government’s debt is sustainable if its rate of increase is lower than rate of growth of GDP, helping bring down the Debt/GDP ratio. (Assume debt of a country at 60 and GDP of 100 implying debt/GDP ratio of 60%. If debt grows at 10% to 66 and GDP grows by 12% in nominal terms to 112, its debt/GDP would come down to 59%). Indian government’s debt movement since 1980 show two distinct phase – a period of profligacy till about 2000 followed by a period of consolidation. In FY81, India’s total debt (including state government’s debt)/GDP ratio was 48% which rose to as much as 69% by FY91. With the gap between debt and GDP growth coming down in 1990s, debt/GDP increased but marginally to 74% by FY01. For the next 15 years, GDP grew faster than debt helping bring down the ratio to 67%.
While the debt/GDP ratio rose sharply to 89.5% by FY21, state governments debt has risen faster than central government during this period. As per RBI database, state government’s debt has risen by 14.7% during FY15-21 against 11.7% for central government. While state governments were less profligate till about 2000, their debt started to rise faster after that, possibly a result of emergence of regional parties who ran state government leading to greater friction between center and state. State government’s debt as a percent of central debt has risen from average of about 35% in 1990s to 50% now. The finance commission has expressed serious reservation about freebies being extended by state governments and has recommended punitive measures in case of breach of debt ceiling.
It would be worthwhile to recall that Government’s indiscriminate spending and the foreign exchange crisis of 1991 led to implementation of some tough measures. Two of these were discontinuation of printing of money to finance government’s deficit also called monetization of deficit and FRBM Act (Fiscal Responsibility and Budget Management). The Act mandated central government to limit its fiscal deficit to 3% by end of FY21 and reduce its debt to 40% of GDP by end of FY25. In view of the pandemic, FY21 budget invoked the clause allowing government to breach the limit.
The second figure affected by government’s debt is the interest payments. This rose by 23% CAGR during the 80s but declined to 18% in 90s and further to 9% and 11% in the subsequent decades. Interest payments as a percent of total government expenditure stood at 14% in 1980s, which rose to 30% by late 90s. This came down to about 20% subsequently but is projected to increase to 25% in FY25. It may be noted that higher outgo on interest payments severely constrains government ability to spend on productive projects. Average cost of government borrowings had risen to 8.3% in late 90s which is now down to about 6.5%. While the difference doesn’t look too much, government would have paid additional interest of nearly Rs 3.4 lakh crore based on the interest rate of 1990s!
While high government’s borrowing impacts the financial market, the pandemic years, between FY20-23, did not see much disruption. This is so because there was limited demand for loans from the private sector, particularly corporate sector because of risk aversion. As per RBI database, banks lent 81% of the deposits that it received during FY17-20 to private sector which came down to 72% during FY20-23. With the decline in demand for loan, banks had more funds available for government. As a result, investment in government securities rose from 18% to 33% in the second period. This provides an answer to intensely debated question – does government borrowings ‘crowd-out’ private investment? The critical determinant for this is whether there is a demand for loan in the economy or not. If there are no private borrowers in the market, government borrowings actually act as a support and may ‘crowd-in’ private investment by boosting demand/ consumption. The problem would occur if private borrowings is high but government is not able to manage its finances.
Other than restricting the aggregate debt, government’s performance in managing external borrowings has also been impressive. External borrowings, which were rising at 18-20% rate till mid-90s, fell sharply to single digit subsequently and is less than 5% now. As a share of total debt, it now stands at less than 5%, sharp reduction from a high of 26% in 1992.

This is just a perfect explanation on India’s debt management, every bureaucrats needs to read this once before oath taking. I feel so.. this is just alarming data..
Thanks Srikrishna.. 🙂