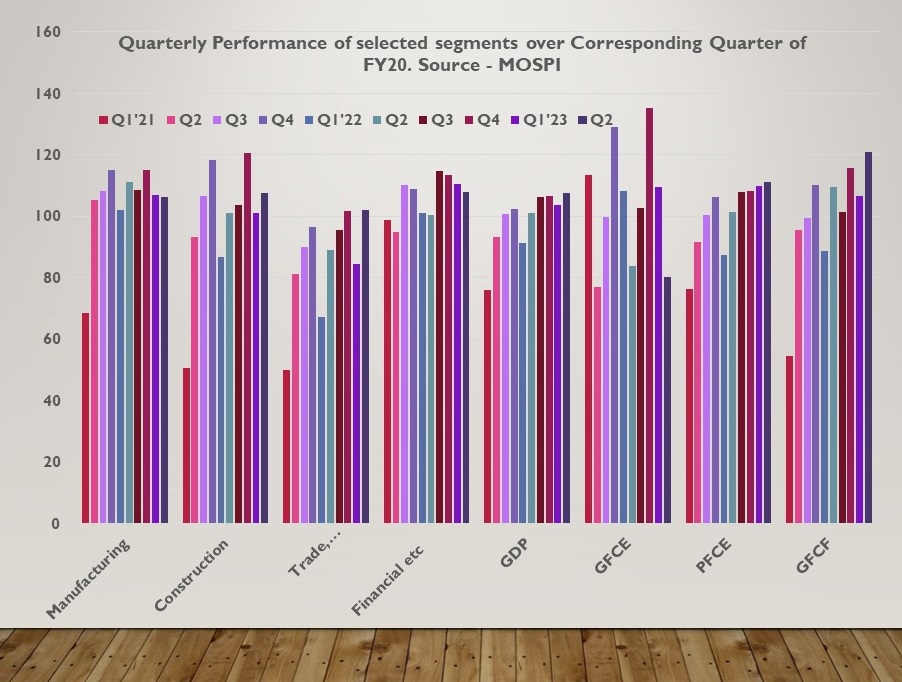
Indian economy grew by 6.3% during July-Sept’22 quarter (Q2’FY23) on constant price basis as per the data released by MOSPI (Ministry of Statistics and Programme Implementation) today. While growth rate is lower than Q1’23, the comparison would not be correct due to varying impact of Covid on economic activity till March’22. Here is a brief analysis of GDP and its constituents.
As per the MOSPI release, India’s GDP was Rs 38.2 lakh crore on constant price basis and rs 65.3 lakh on current price basis during the quarter. (All subsequent comparison is on constant price basis). GVA (Gross Value Added) was Rs 35.1 lakh crore against Rs 33.2 lakh crore last year, growth of 5.6%, lower than GDP growth rate. Lower GVA growth implies government’s net tax collection (taxes minus subsidy) has grown higher than GVA which is a good sign. (GDP = GVA + Taxes – Subsidy). An important comparison could be the performance w.r.t to corresponding quarter of FY20, the year before pandemic and on that count, GDP growth is 6.3% in Q2 vs 3.8% in Q1. The double comparison, against previous year as well as against FY20 makes the analysis repetitious but unavoidable.
Sectoral Analysis –
GDP of the economy is calculated by estimating GVA (Gross Value Added) for eight sectors – Agriculture with share of 16% in GVA in FY22, Mining (2%), Manufacturing (18%), Electricity (& other utilities, 2%), Construction (8%), Trade (hotels, transport etc, 18%), Financial (real estate & professional services, 23%) and Public Administration (& defence etc, 14%). To this, net government tax (tax collection minus subsidy outgo) is added to arrive at GDP.
Most glaring, in terms of sectoral performance, is decline of 4.3% in manufacturing GVA against growth of 4.8% in Q1. In comparison to FY20 also, growth rate is marginally lower at 6.3% in Q2 against 7% in Q1. A possible reason could be that some of the production shifted to first quarter from second due to early beginning of the festive season this year. Mining is the other sector recording a decline during the quarter at 2.8% against growth of 6.5% in Q1. In comparison to FY20, growth is lower at 2,5% against 3.3% in Q1.
Other than these two, all the sectors have recorded growth over previous year. Construction, another important sector for employment generation, grew by 6.6% against 16.8% in Q1. However, in comparison to FY20, growth rate is 7.6% against only 1.2% in Q1 implying significant gain in momentum. The performance is also quite unusual as second quarter is generally a weak quarter for construction with output being about 90-92% of other three quarters average because of rains. ‘Financial, real estate & professional services’, accounting for highest share of 23% in GVA, recorded growth of 7.2% against 9.2% in Q1. However, over FY20, growth rate has declined to 7.8% from 10.5%. Incidentally, the sector along with agriculture, were the only ones to grow in FY21.
Public administration, largely government expenditure, grew by 6.5% against 26.3% in Q1. Over FY20, growth rate remains high at 14.3% in Q2, although lower than 18.9% in Q1. The segment acts as a kind of balancing force which means government increases its expenditure if other segments are weak and withholds its spending if other segments are doing good.
‘Trade, Hotels, Transport etc’, which grew by 26% in Q1 continued to grow, albeit at a lesser pace of 15%. However, over FY20, its performance is most remarkable as it was down 15% in Q1 but has grown by 2.1% in Q2. This is the first quarter when all the eight sectors have shown growth over pre-pandemic quarter, marking the end of K-shaped recovery.
Expenditure Analysis –
GDP is also calculated from the expenditure side and is equal to amount spent by the three segments – expenditure by households called private final consumption expenditure (PFCE), expenditure by government called Government final consumption expenditure (GFCE) and expenditure on creating physical assets or investment called gross fixed capital formation (GFCF). Trade and few other adjustments are made to arrive at final GDP through this route. Approximate share of the three were 57%, 11% and 32% in FY22.
PFCE has accelerated its growth over FY20, from 9.9% in Q1 to 11.2% in Q2. Over FY22, growth rate is 9.7% against as much as 60% in Q1. Consumption seems to have shrugged-off the commodity price rise. With cooling down of prices in the current quarter, consumption could see further boost this quarter. Investments (GFCF) has accelerated, growing by as much as 21% in Q2 over FY20 against 6.7% in Q1. The increase in activity is also corroborated by sharp increase in credit growth, banks’ loan disbursal, which has crossed 15% against about 8% till the end of FY22. Investments may have got some support from government sponsored Production linked Incentive (PLI) scheme also.
GFCE (Government expenditure) has fallen sharply during the quarter against all benchmarks. Over FY22, the decline is 4.4% against increase of 11.2% in Q1 and against FY20, the decline is as much as 20% against increase of 9.6% in Q1. Government spending in March’22 quarter was 135% of corresponding quarter of FY20 which is now only 80% of the same. So, what does this mean? As stated earlier, government appears to be adjusting its expenditure as per market conditions, increasing the same when the momentum is low and withdrawing when other segments are doing well. With significant increase in revenue mobilization and cooling down of prices which reduces subsidy burden, government should be able to bring down its fiscal deficit for the full year more than budgeted.
